
| Ernst U. von Weizsaecker |
|
|
|
 |
 |
|
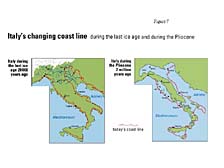
figure 8
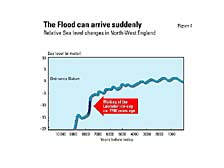
figure 9
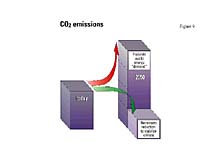
figure 10
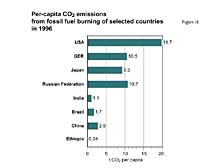
figure 11
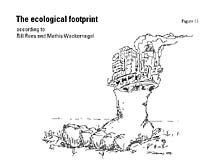
figure 12
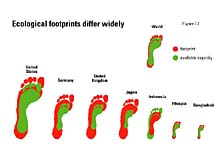
figure 13
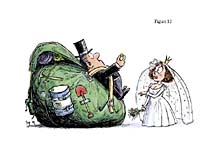
figure 14
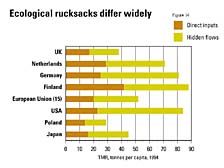
figure 15 |
Figure 8
This is how Italy looked during the last Ice Age. The dotted curve
is today's Italian coastline, and this is Italy how it looked during
the last Hot Age. You in Japan will be able to more or less imagine
how Japan would look under these conditions, in particular the Tokyo
and Kansai agglomerations.
I read the newspapers last week that the island of Tuvalu was in
the process of relocating people who live there because of a tiny
sea level rise of some perhaps 30 centimeters so far. This already
threatens the existence of Tuvalu.
Figure 9
What is going to happen if parts of Greenland break off? Theoretically
this could happen and, in fact, it could happen rapidly in a non-linear
fashion. Some 7,800 years ago there was such a non-linear event.
Until 7,800 years ago Labrador and the Hudson Bay were covered by
ice as is Greenland today, and in a matter of a few decades, it
could have been a few weeks, the sea water table rose by 7 or 8
meters. People say that this is the historic background for the
deluge or "Atlantis saga" at that time because of God's making.
Mankind had not a lot to do with it, but suffered from it. But this
time, global warming is essentially human made.
Figure 10
So much for the climate challenge. We seem to be well advised to
aim at stabilizing carbon dioxide concentrations. In order to achieve
that, according again to the Intergovernmental Panel on Climate
Change, what we would have to do would be to reduce carbon dioxide
by at least 50 percent. On the other hand, energy experts tell us
that we are going to have a doubling instead. Why? Well, quite easily
because people in India and Bangladesh and Egypt and China, etc.,
and, of course, all Africa, South America, etc., are going to do
the same as we have shown them, to be the core of our industrial
success story, including our story of becoming clean and rich. So,
the gap is opening before us at least as large as the factor of
4. Bio is absolutely right that this is but a step in the direction
of a factor of 10.
Figure 11
Let me, from this climate story, turn to a different way of putting
the same challenge. This is the per capita carbon dioxide emission
where you see easily that India, Brazil, China, Ethiopia have much
lower carbon dioxide emissions per capita than the industrialized
countries.
Figure 12
This is the other story. It's the ecological footprint according
to Matthis Wackernagel and William Rees. It is the size of the area
that we need to produce food, to have nice conference rooms like
this, for our living, for our cars, the streets, the cotton for
our underwear, the wool for our suits. Of course, the sheep need
space, and there must be space for the cattle feed, etc., etc. And
then, of course, energy also is quite area-intensive. You can have
some kind of renewable energy equivalent for oil or uranium because
oil and uranium are both exhaustible resources. They are not available
for a very long time. Actually, the reach, the availability of uranium,
is not larger than the availability of natural gas. Don't believe
that nuclear power is going to be the solution, leaving aside all
the problems of terrorism, etc.
Figure 13
Now we see that, as we would expect, the footprints, which is the
red color, are normally larger than the available capacity even
for the world. The latter statement is perhaps a riddle for you
and results from the fact that the energy-related footprint is,
of course, not now used in renewable energies because we are still
privileged by using some fossil fuels and some uranium, but this
is not a sustainable kind of energy use. That we in Germany or Japan
or in the United States have larger footprints than are available
is partly explained by the fact that we export the footprints to
places like Papua New Guinea or Indonesia or Siberia. The footprints
are, in a sense, equivalent to the ecological rucksacks.
Figure 14
Figure 15
This is sort of a caricature for the ecological rucksack of a gold
ring, a wedding ring. It's quite a heavy gift and, again, not sustainable.
And then you see that the ecological rucksacks are quite heavy already,
if you take the direct rucksacks. If you add the hidden flows it
gets even larger.
|
|
|