 
| マイケル・W・ハンカピラー |
|
|
|
 |
 |
|
[figure 16]
[figure 17]
[figure 18]
[figure 19]
[figure 20]
[figure 21]
[figure 22]
[figure 23]
[figure 24]
[figure 25]
[figure 26] |
But on top
of that, one needed to change fundamentally the chemistry. One would
want to make the signal that one could get out of a DNA sample strong
enough that a large sample wouldn't be required, because the cost
of the chemicals used to generate the samples is high. A lot of
work had to go into going from the original, single step Sanger
sequencing chemistry, in which the labels were applied to a fairly
large DNA sample, to one in which you could use a tiny bit of sample
and recycle it during the course of the reaction, while getting
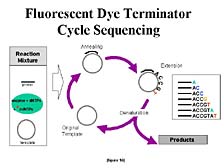
more signal out of it. [figure 16] This involved going to a different
labeling scheme, putting the labels on the chain terminators, which
allowed the reactions to be pooled for analysis ahead of time, so
you only did one-fourth as many reactions, rather than doing them
separately in four different tubes. These subtle changes wound up
having a pretty big role in reducing the overall cost of the project.
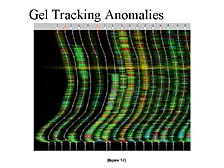
Finally, and this was something that Craig's group was one of the few in the world to realize the importance of early on, one of the problems with slab-gels is that they don't behave in a totally optimal fashion. [figure 17] If you don't make the gels just right, control the temperature variations across the surface (these gels are on the order of one meter tall by 30 or 40 centimeters wide by a couple of millimeters thick) and fix drastically the separation path, the bands tend to wander as they go down in the gel. And that, as one might expect, plays havoc with the computer interpretation of what the banding patterns are. This was still as much of a problem in the automated, fluorescence-based system as it was in the old autoradiograph-based methodologies.
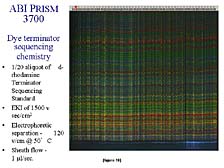
Therefore, one of the key things about going to a capillary-based system, where you have a physical barrier or a physically contained path through which each of the samples of DNA move from the point of application to the point of analysis at the end of the separation path, is that you know exactly where a piece of DNA will wind up, if you know where it started. [figure 18] This ability gave rise to not only a better data interpretation of any individual sample, but also guaranteed that if you put two samples that were related to each other on known points at the top of the separation system, they would still be paired up when they reached the bottom. This ability to do what's called "paired end sequencing," turned out to be key to the large genome shotgun methodologies, which Craig pioneered. This was first appreciated by Craig's group.
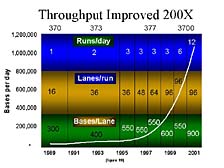
The net result of all of this is that over the 15 years since we introduced our first automated system, the pace with which one could conduct DNA sequencing has gone up dramatically. [figure 19] This slide illustrates the ability to generate data from a single instrument from the late 1980's to the present. You can see, particularly in the last few years, that the output of a single system, and more importantly, the output of a single person operating the system, has gone up dramatically. In fact, output has increased by about 200 times. Consequently, the cost to generate an individual bit of DNA information has gone down by a corresponding amount. Today, it costs approximately 1% of what it did 10 to 15 years ago to sequence one base pair.
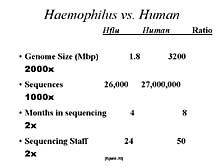
One way to illustrate this is a table I put together, with some rounding freedom. [figure 20] In comparing the effort to generate the first sequence of a free-living organism, Haemophilus influenzae, at TIGR, to that required to sequence the human genome, at Celera, there was about 2,000 times as much information to be collected, with about 1,000 times more sequences to be analyzed. However, going from the bacterial genome to the human genome required only twice as much time, and only about twice as many people. Most of these people were software engineers and people interpreting the data. Clearly this kind of productivity increase was a big factor in being able to carry out the human genome sequencing work.
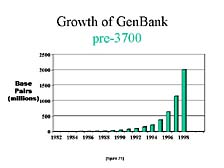
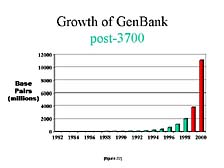
Another way to look at this is to compare the publicly available information. [figure 21] This is a chart that shows the growth in the number of sequences submitted to the U.S. national repository for DNA sequences, GenBank, from the early 1980's to 1998. You can see a steady increase with the doubling time of anywhere from 15 to 18 months. [figure 22] As dramatic as this was, if you look at what happened in just the next two years, you almost lose the scale from those previous years. In the year 2000, half of all the DNA sequences that had been collected up to that point were generated in the last 12 months, with most of it done on the 3700 and all of it done on instruments with the same general fluorescence labeling concept.
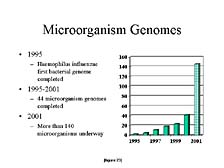
Another way to look at this is by looking at the sequencing of other organisms. Microorganisms are clearly important for a variety of reasons, not just health-related, but important commercial ones as well. Here again, the ability to apply these tools to smaller organisms has also increased in utility over this time frame. The number of microbial genomes being worked on this year exceeded the combined number of microbial genomes sequenced over the previous five years, starting with the first one sequenced at TIGR in 1995. [figure 23]
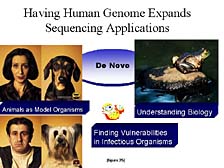
All that said, sequencing itself, particularly the sequencing of the human genome, is really just a starting point. [figure 24] This is a paraphrased comment from two people, Francis Collins and Craig Venter, who don't always see eye to eye. However, on this particular point, they do. Sequencing really gives you a basic starting point to begin to understand how genes affect our biology. [figure 25] The sequencing of genomes give rise to the sequencing of other genomes, because one wants to compare the gene structure of one organism versus another to help understand how genes function in each organism. Comparative sequencing is a way to do this. Even though it's done on a routine basis, it winds up being a very important issue.
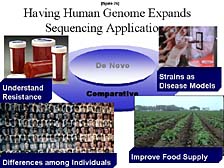
If you look at comparative sequencing from another perspective, which is to look at the variation in gene sequences at the micro level among individuals within a particular species, you get another important aspect of how this technology can be used to understand gene function. [figure 26] The slight variations in genetic sequences (in the elements that are key functional components of genes that give rise to changes in the functional characteristics of the proteins that they produce) wind up being a key to understanding not only how disease processes work, but also understanding how resistance to antibiotics occurs in microorganisms, how the ability to respond well or unfavorably to particular treatments for disease works, and so on. All these things become very important. In fact, looking at these differences among individuals is a lot of the effort of current large-scale sequencing programs. |
|
|