| Nobuyoshi Fugono |
 |
|
|
 |
 |
|
[Slide 8]
[Slide 9]
[Slide 10]
[Slide 11]
[Slide 12]
[Slide 13]
[Slide 14]
[Slide 15]
[Slide 16]
[Slide 17]
[Slide 18]
[Slide 19]
|
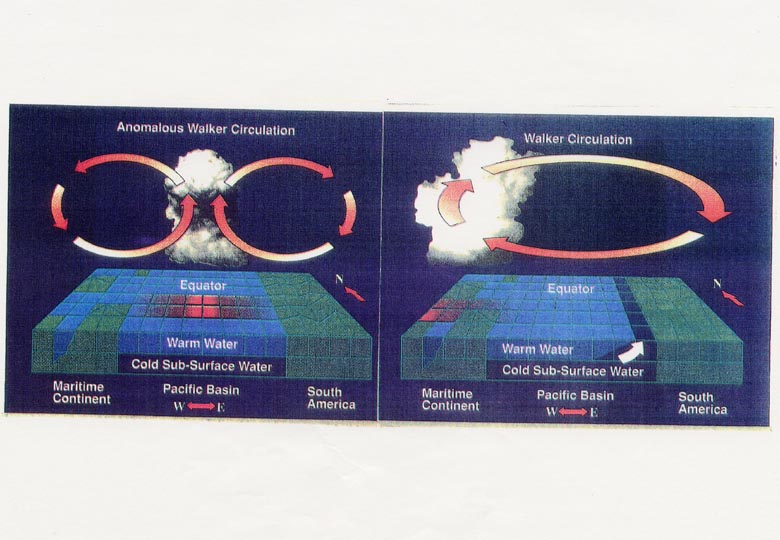
[Slide 8]
The typhoons are very small-scale examples of the phenomenon, which only move around their local area. The famous example of this phenomenon is the El Nino. Usually, strong rain falls in the western region of the Pacific Ocean and the atmosphere circulates as in this figure, and then the trade wind blows from east to west along the equatorial belt of the Pacific Ocean.
This wind causes warm water in the upper part of the Pacific Ocean to flow westward, and cold water flows up from the bottom at the coast of South America. The cold water is rich in nutrients and breeds many fish such as anchovies.
For unknown reasons,@when this rain region moves to the eastward, these phenomena become weak. In that case, the cold water can't flow up and fishes vanish. This phenomenon is called the El Nino.
As you know, it has become understood recently that the El Nino causes unusual climate all over the world.
It has been unclear why this rain region moves to eastern Pacific Ocean. There are some results of studies such as the effect of the monsoon in the South-East Asia, or the effect of the weather around the Himalayan Mountains. We started the project with the hope that the observation of the rainfall in the tropical area may give information for studying of the cause of these phenomena.
Now, I'd like to tell you about the history of our development of the Tropical Rainfall Measurement Mission (TRMM).
[Slide 9]
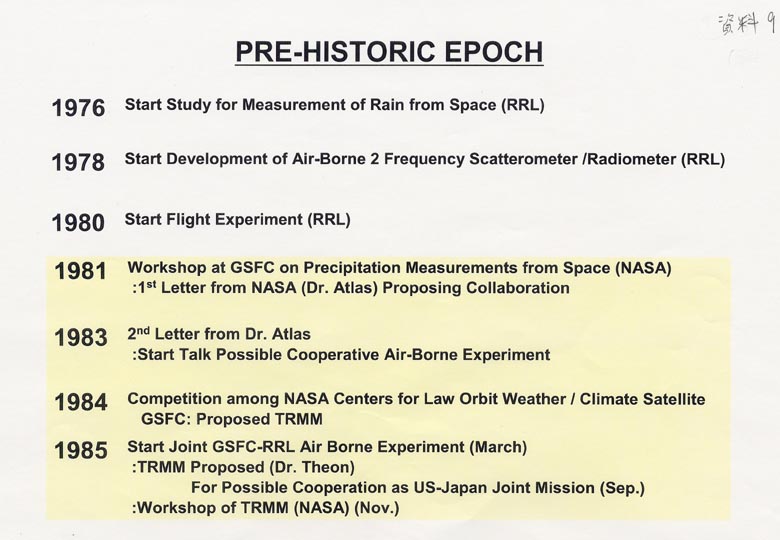
In the mid '70s we decided to start the project, including the necessary fundraising.
[Slide 10]
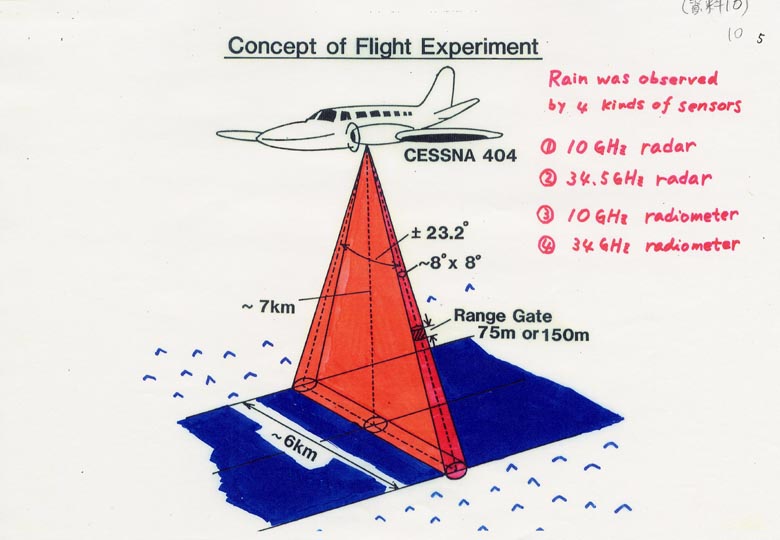
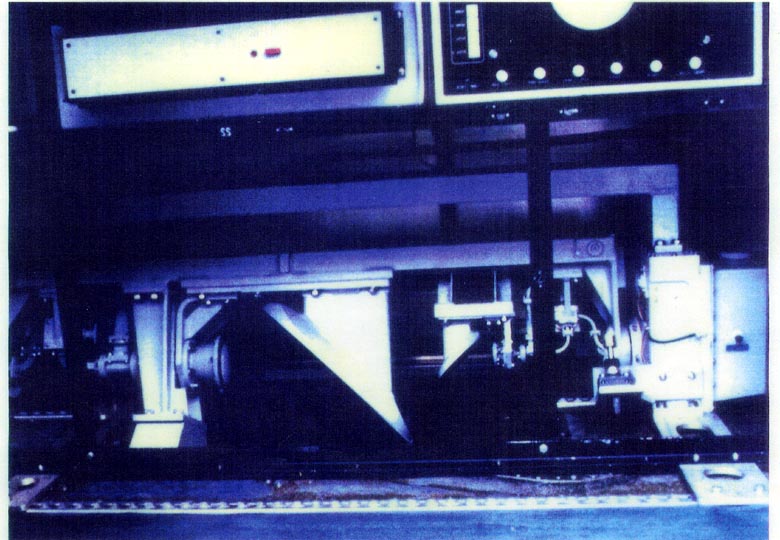
In the beginning, we developed a dual-frequency rain-scatterometer/radiometerand installed it on a small airplane. Dr. Okamoto may explain these instruments in detail later. The airplane flew like this with the antenna waggled at right angles to the traveling direction, to obtain all of the data inside the triangular column. The actual experiments began around 1980. (see also: Slide 9)
[Slide 11] [Slide 12] [Slide 13]
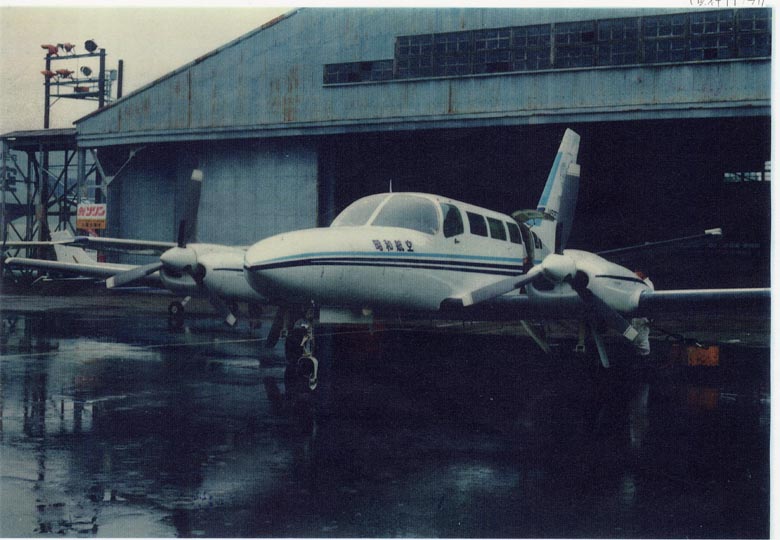
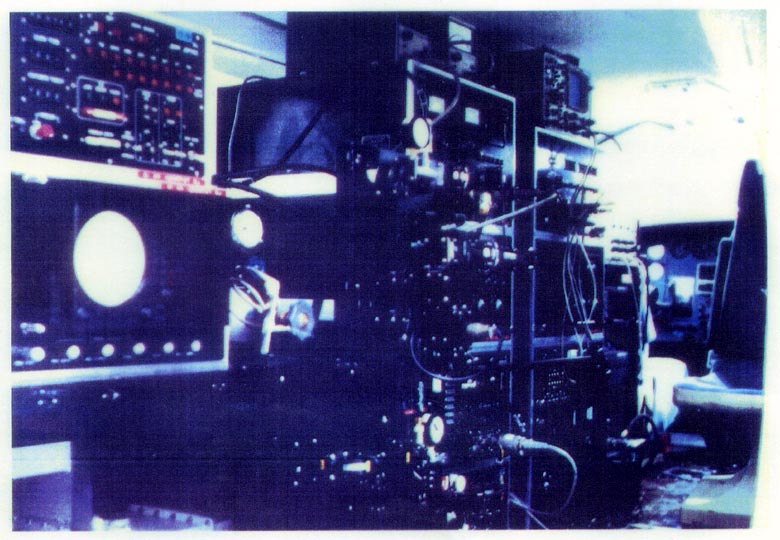
This small airplane flew up to an altitude of 7000m. The inside of the airplane was very small, so we had to walk bending over. There was also a hole drilled in the bottom of the fuselage to emit radio waves and to receive radio waves backscattered by the rain. At that height of 7000m the outside atmosphere could enter the airplane, so we were not only very cold but also short of the oxygen. All the members wore oxygen masks. In one case, being preoccupied with the experiment, a participant was not aware that his oxygen mask had come off, and nearly lost consciousness. All members worked in extremely cruel conditions.
[Slide 14]
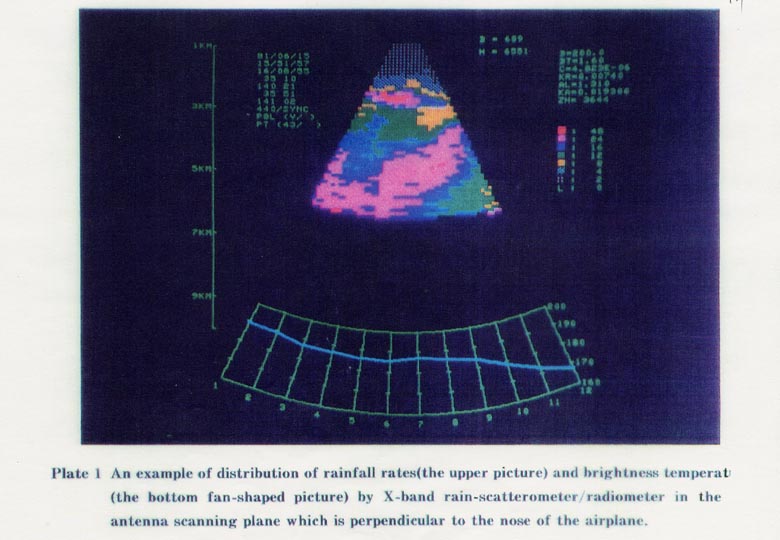
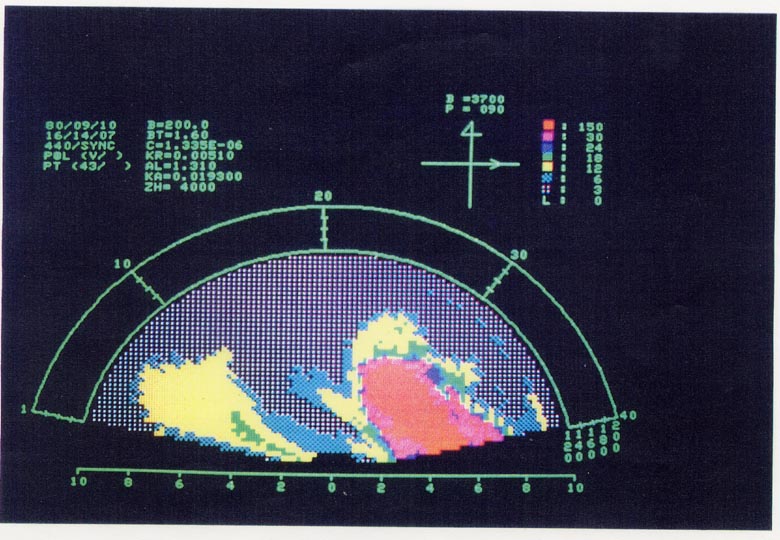
I'll show several examples of the data obtained. This one, with the airplane flying like this, the distribution of rain is in the vertical plane perpendicular to the direction of the plane's movement.
[Slide 15]
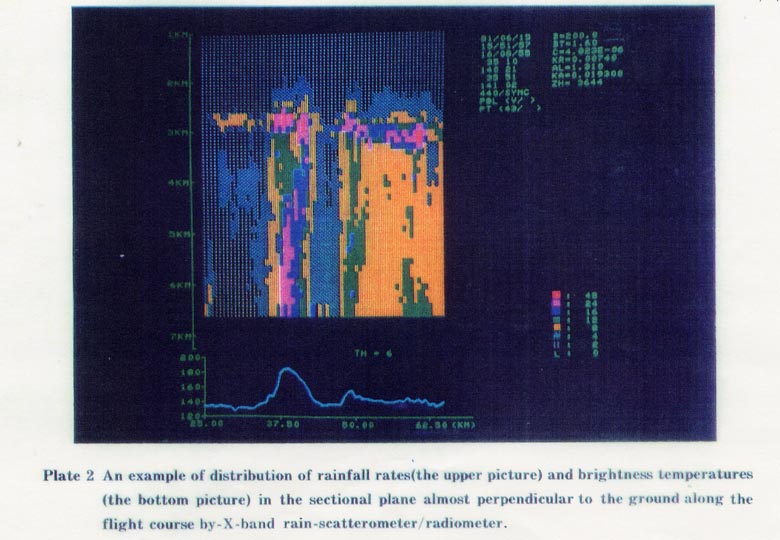
This is the rain distribution in the vertical plane parallel to the direction of the plane's movement.
[Slide 16]
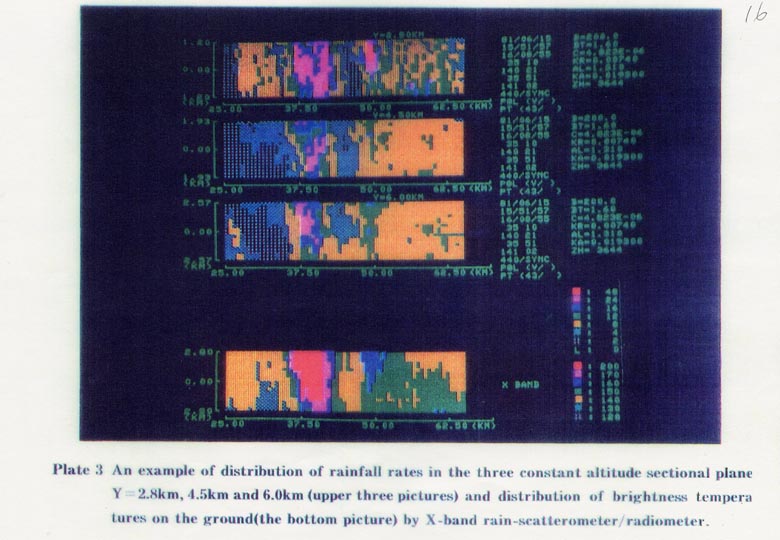
And this is the rain feature on a horizontal plane at different altitudes. As you can see from this data, the rain never falls evenly, and in some parts, there are cases where rain falls up-ward.
[Slide 17]
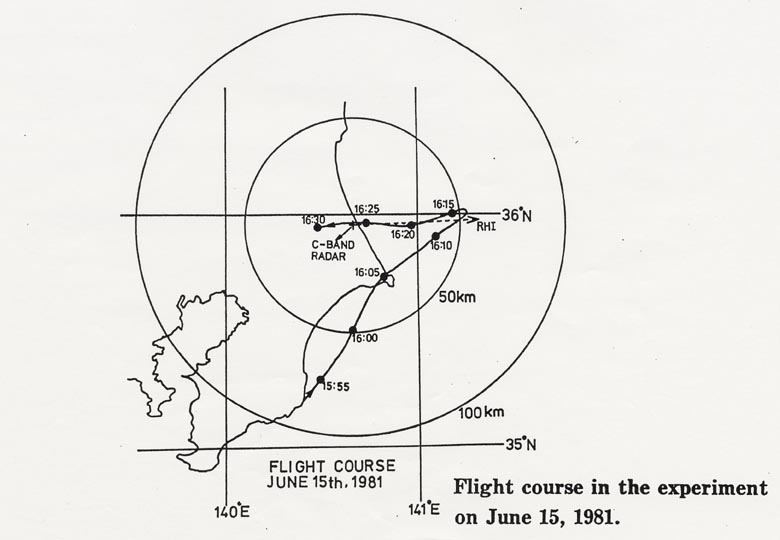
We did experiments on the ground many times using the same radar, because it was expensive to use airplanes.
[Slide 18]
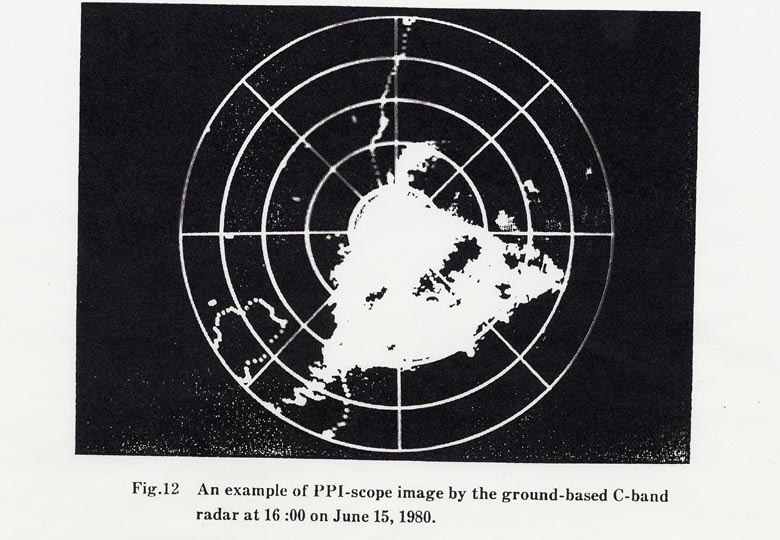
Furthermore, the experiments for the feasibility of air-borne radar and for the comparison of data were conducted in the area where a ground radar had been installed. Those ground radars had been built for the satellite communication experiments. The experiments were done at the same time from above rain and on the ground. This is the structure of rain and cloud at that time.
[Slide 19]
At the time when we were doing those experiments, the project to measure global rainfall seemed to have started in the USA (see also: Slide 9). In 1981, immediately after we publicized our experimental results, we received a proposal for a joint flight experiment from Dr. Atlas of NASA, who had been one of pioneers of precipitation radar in the USA.
However, since we knew that we did not have a sufficient experience with the experiment and were not prepared to respond affirmatively to the proposal, we didn't accept the proposal. In 1983, after receiving the second proposal from NASA, we began to discuss the joint experiment again. We started a joint experiment with the USA in 1985.
|
|
|