| Charles Elachi |
 |
|
|
 |
 |
|
[Slide 8]
[Slide 9]
[Slide 10]
[Slide 11]
[Slide 12]
[Slide 13]
|
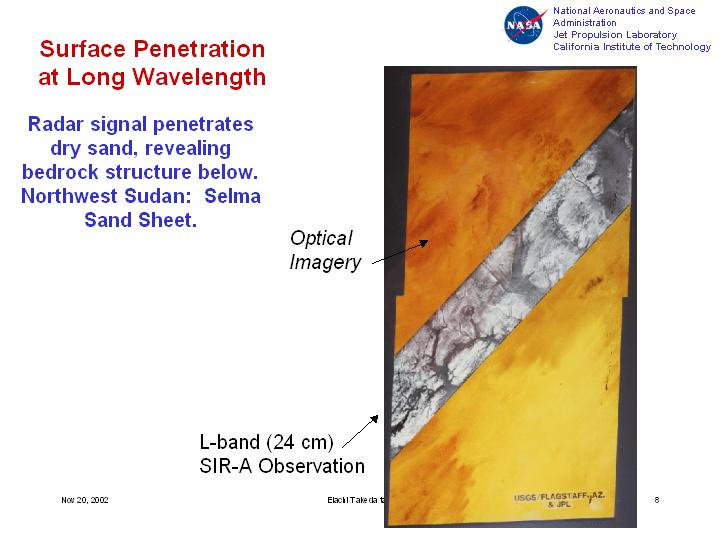
[Slide 8]
Or in the case of sand regions, through the sand which covers the surface. So let me give you an illustration. This is an example of radar and visible images taken over the Sahara desert. This part here was taken with a camera, like with your eyes - that you will see - and this section here was taken with the radar. So as you can see, we see features like a drainage channel that you see here or the drainage channel that you see here which are below the surface, covered with sand, and the radar penetrated through that cover and showed us the river channels which were there a long time ago in northern Africa, which have dried up and got covered by sand. So the unique feature here is to show us what's below the surface.
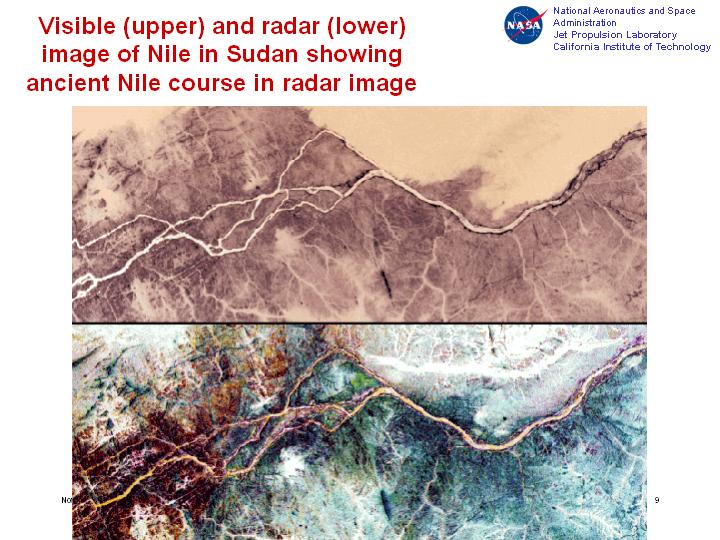
[Slide 9]
This is another example - this is in the Sudan. This is a visible image and this is a radar image. In the visible image, you see the Nile which you see in therec and this is an area covered by the sand. When you look at the radar, you there are drainage channels here. This was the old drainage channel of the Nile which was changed to come here and then got covered with the sand. But the radar allowed us to penetrate through the sand and show us the old Nile.
[Slide 10]
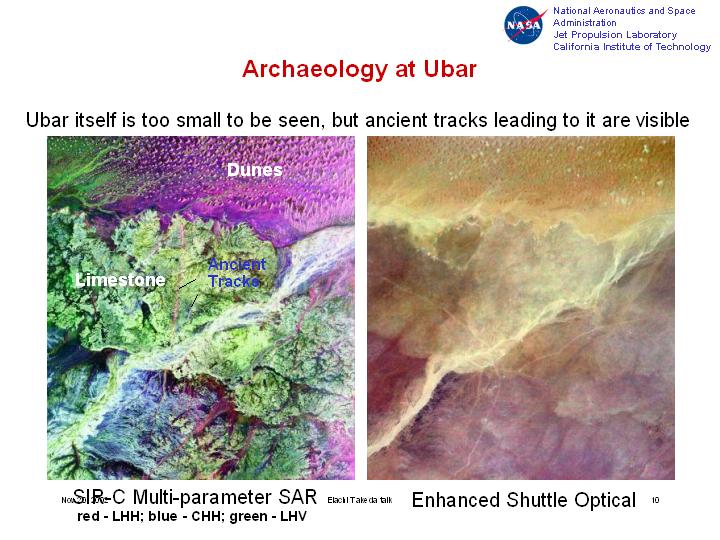
This is another example we used in the Arabian Sahara desert. This again is an optical image, and this is a radar image. And that allowed us to see ancient tracks that you seen in here that you do not see in here. But the radar penetrated below the surface. And this was used to actually discover some archaeological area for the city of Ubar, or the trading post of Ubar, which turned out to be in this location in here. So that illustrates for you the capability of penetration that this radar instrument is capable of.
[Slide 11]
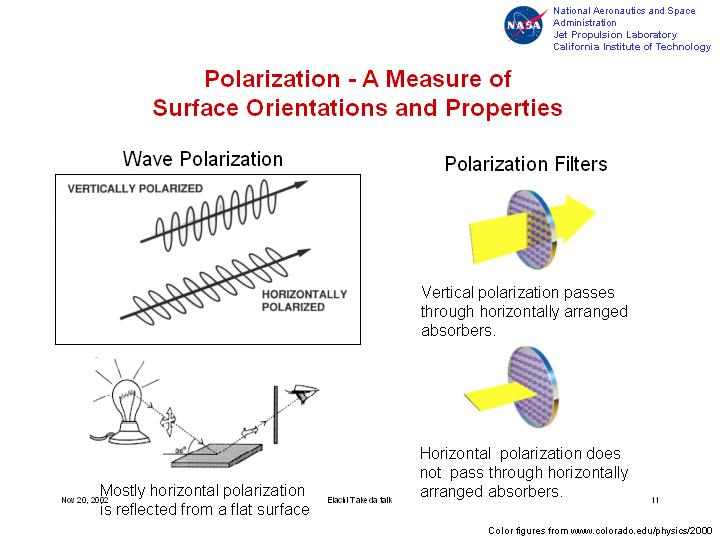
Now there is an additional feature, which we use, which we call polarization. That's similar to the case of polarized glasses, that you use to eliminate sun glare. So it's a direction of what we call the vector that is used in the signal. Vertical polarization here and horizontal polarization here.
[Slide 12]
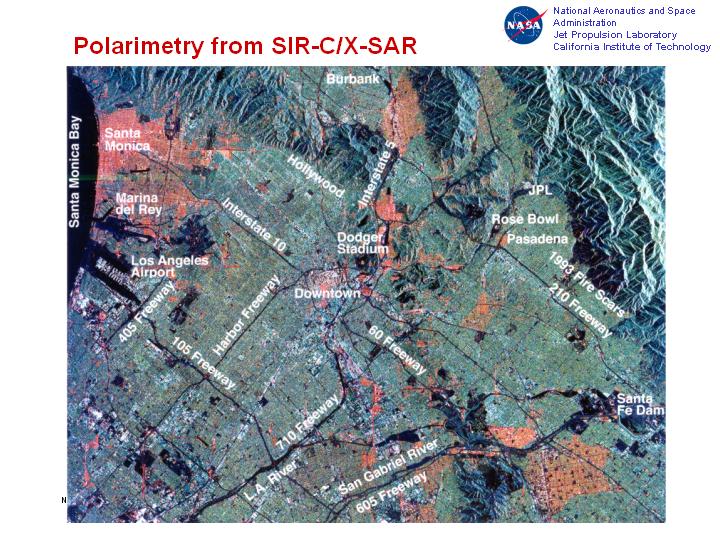
So it's again similar as in the optical case, and we use the capability to generate images like you see in here. This is the Los Angeles basin taken from satellite. We show you the coast here, this is the Los Angeles airport, if any of you have visited Los Angeles. These are two runways to the airport - they show dark. These are the different terminals, Japan Airline is I think somewhere here - you almost can see the airplanes. These are the freeways, which look very dark here, and this is Jet Propulsion Lab the institution where I work. We always make sure that it looks like very bright in the images. And these are the mountains behind the Jet Propulsion Lab. and you can see here some of the faults - the geologic faults - that you see in here which are a segment of the San Andreas Fault. So these kinds of images are acquired from satellite and it's amazing how much detail you see in them. For example, this is the football field for the Rose Bowl.
[Slide 13]
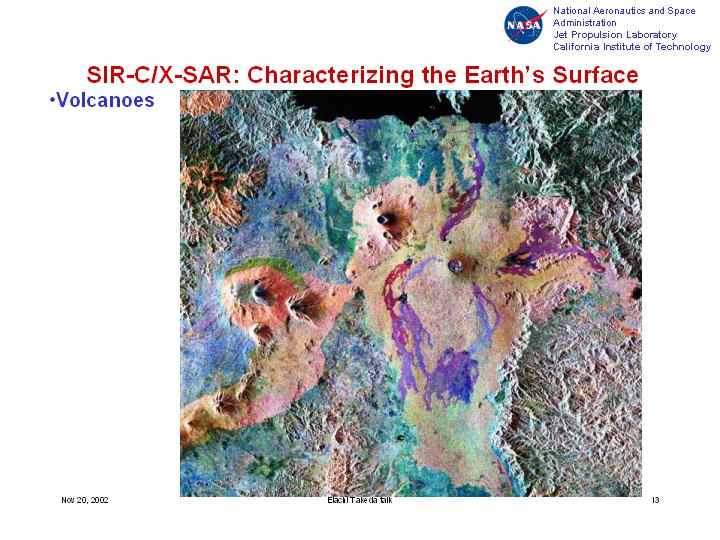
Now I am going to show you three or four examples illustrating how we use the satellite for application. This is an image taken in Congo, and it shows you the different volcanoes in an area which is volcanically active, and these are the lava flows which are coming down, from these volcanoes. This area usually is cloud-covered but the radar actually penetrates through the clouds, similar to your radio signal - even if it's cloudy you still hear your radio. So the microwave actually penetrates through the cloud. So this allows us to monitor when the volcanoes are active to monitor the lava flows even when it's completely cloud covered, or during the night, or in the daytime it does not make any difference.
|
|
|