| Charles Elachi |
 |
|
|
 |
 |
|
[Slide 23]
[Slide 24]
[Slide 25]
[Slide 26]
[Slide 27]
[Slide 28]
[Slide 29]
|
[Slide 23]
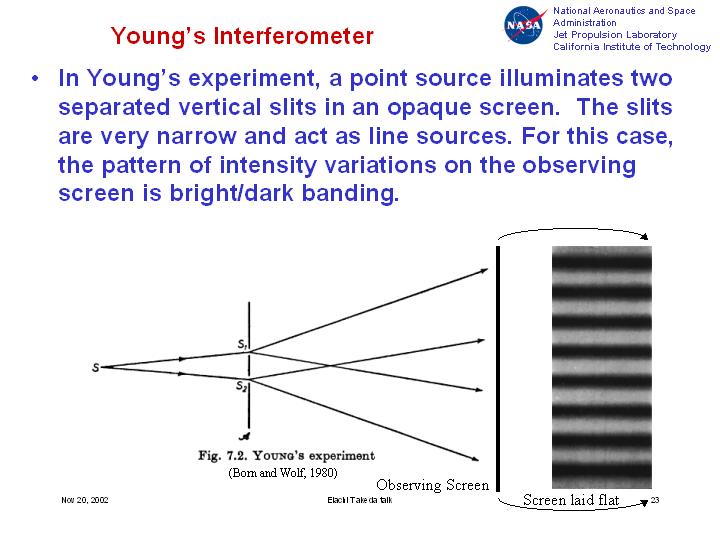
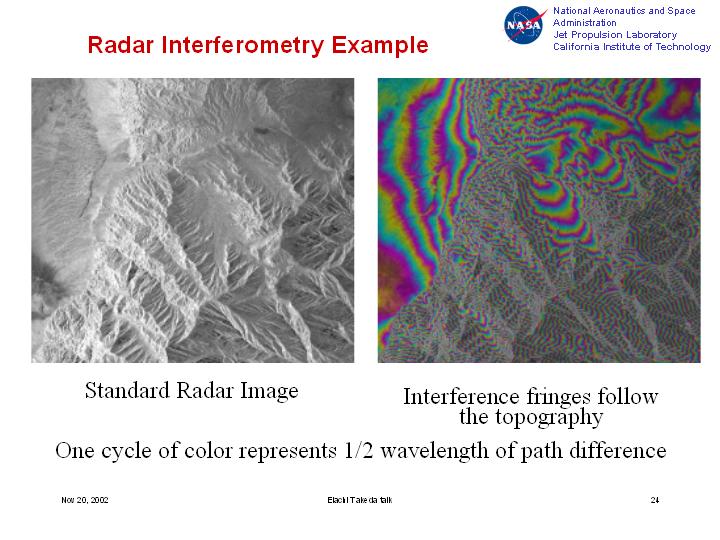
More recently, about few years ago, we developed a new technique, or expanded the capability of this radar by doing what we call interferometory. What that technique isc if you have two radar systems, one here and one here, by combining the signal from them, you get fringes. So many of you who have technical background, I'm sure you remember the Fresnel fringes from your optics class.
[Slide 24]
So what happens if you are taking now images over a terrain, like you see in here, and you do it with two radar instruments and combine the signal, we see fringes here which follow the contour of the topography of the surface. So this allows us now to see in the third dimension. So instead of having two-dimensional images, now we can get three-dimensional images by using this interferometory technique. This technique was discovered and developed for radar few years ago.
[Slide 25]
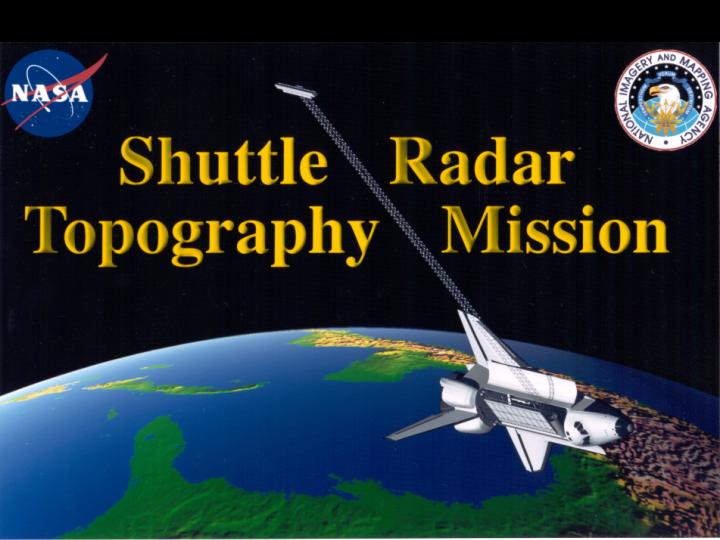
So we flew a mission in the year 2000, called Shuttle Radar Topography Mission, where we had the radar carried by the shuttle that you see in here and then we had a long boom, that's about 60 meters. We put second radar in here. So now we had images taken with these two radars. We combined them together to do the interferometry and were able to see in three dimensions.
[Slide 26]
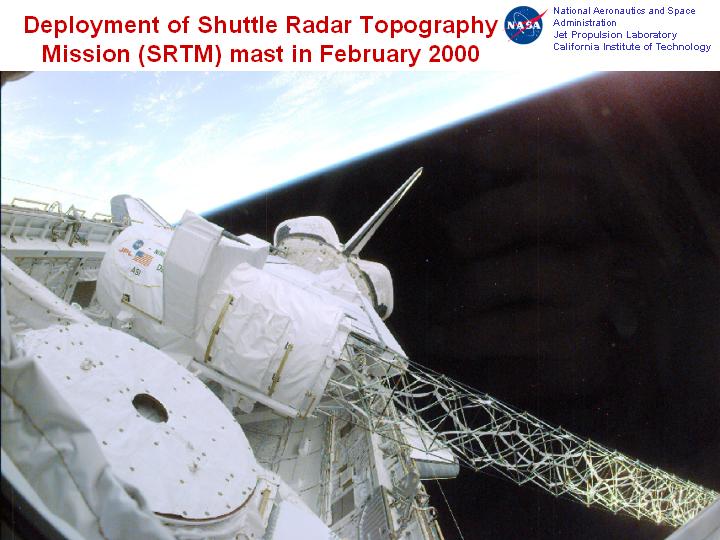
This is the picture inside the shuttle, and this is a boom that I was showing to you earlier.
[Slide 27]
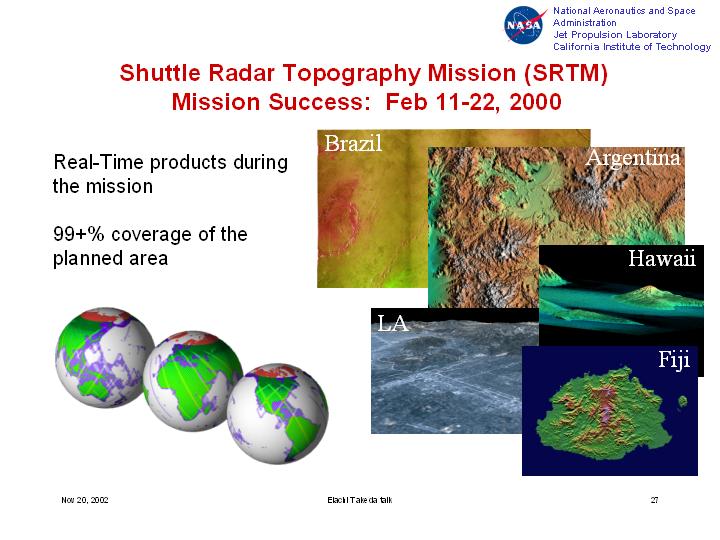
This mission, which was flown in February 2000, allowed us to map the whole world in 11 days - you can see the coverage in here - and allowed us to generate three dimensional images of everywhere around the world.
[Slide 28]
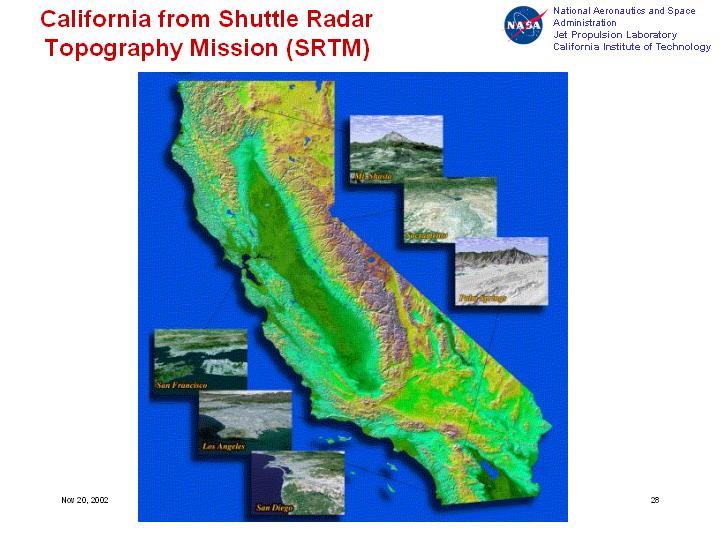
Now I am going to show you some examples of those images. I am going to show you examples from the state of California first. With this system, we mapped the whole state of California literally in one day and generated the topography. So the red color is high altitude and the green color is low altitude. So we generated a topographic map of the whole state of California, every 25 meters with height accuracy of about 5 meters. Normally with the standard technique this would take probably 10-15 years to map all of the state of California, using traditional techniques. In this case, in one day, we mapped the whole state. That illustrates this new capabilitycor the power of this new capability.
[Slide 29]
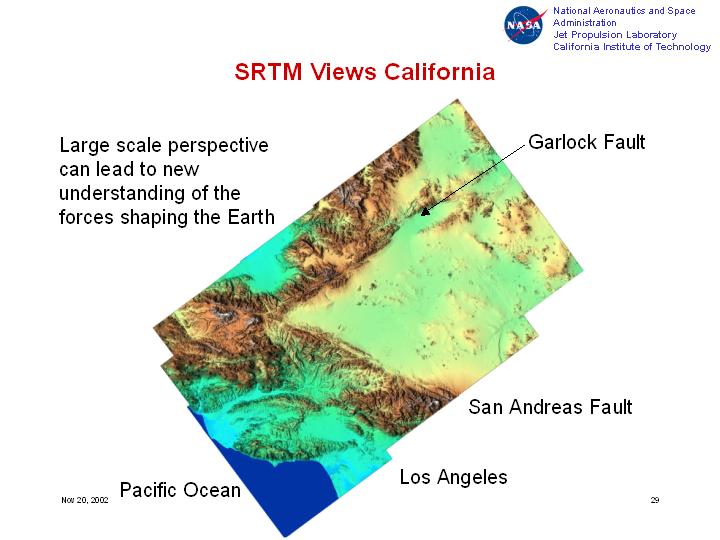
Now let me focus on this area around Los Angeles. This show you the detail of the topography, Los Angeles is down here, Santa Barbara is up here, and you clearly can see the San Andreas Fault and Garlock Fault. These are major faults, tectonic faults, which are in California.
|
|
|