| Charles Elachi |
 |
|
|
 |
 |
|
[Slide 14]
[Slide 15]
[Slide 16]
[Slide 17]
[Slide 18]
[Slide 19]
[Slide 20]
[Slide 21]
[Slide 22]
|
[Slide 14]
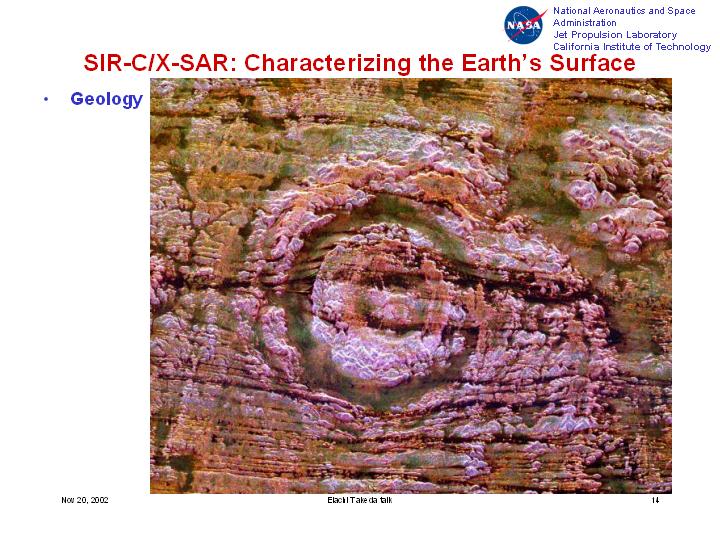
This is another example for geologic mapping. This is a crater which is in Northern Africa, and you can see some of the geologic layers and the erosion which occurred as a result of wind blowing over many millions of years which have eroded the surface. And geologists use these kinds of images to generate geologic maps.
[Slide 15]
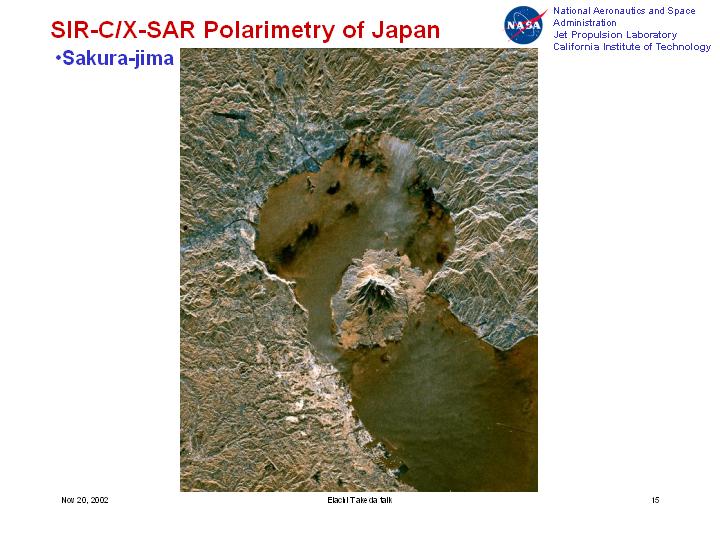
This is an example closer to your home here. It's in Japan, and that shows the area of Sakura-jima. You're probably more familiar with it than myself - this is the bay and this is the ocean and these are urban areas that you can discriminate because usually they have very strong return. By monitoring these urban areas over many years, you can look at the expansion which is occurring for urban planning.
[Slide 16]
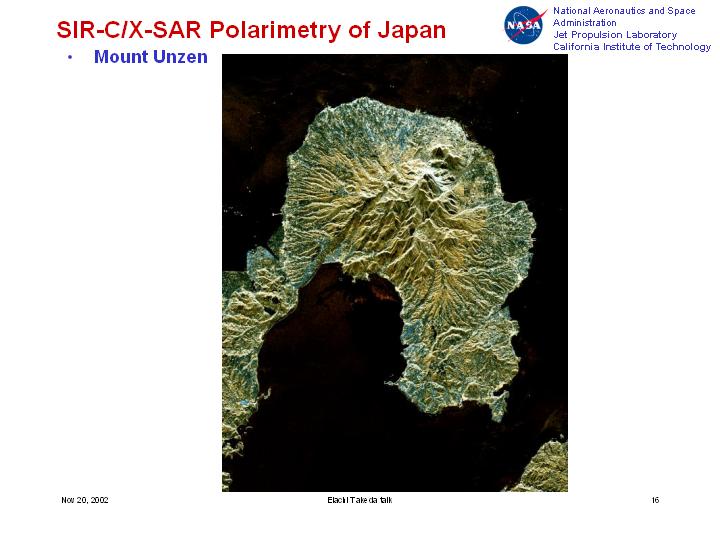
This is another example of mount Unzen, and one interesting thing you see are these bright points.
[Slide 17]
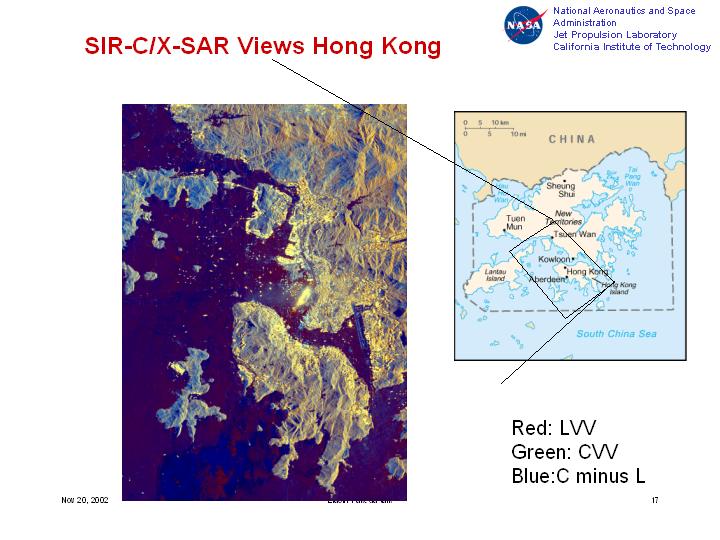
These are vessels which are in the ocean, so you can monitor the vessel motion. One interesting example is this image of the harbor of Hong Kong. This is the city of Hong Kong here and here, and you see all the different vessels which are in the harbor of Hong Kong. So by monitoring these vessels, people actually can look at their motion, and be able to track them, on a regular basis from satellite. Again, if it's day or night it does not make any difference. So that's one application for monitoring ship motion.
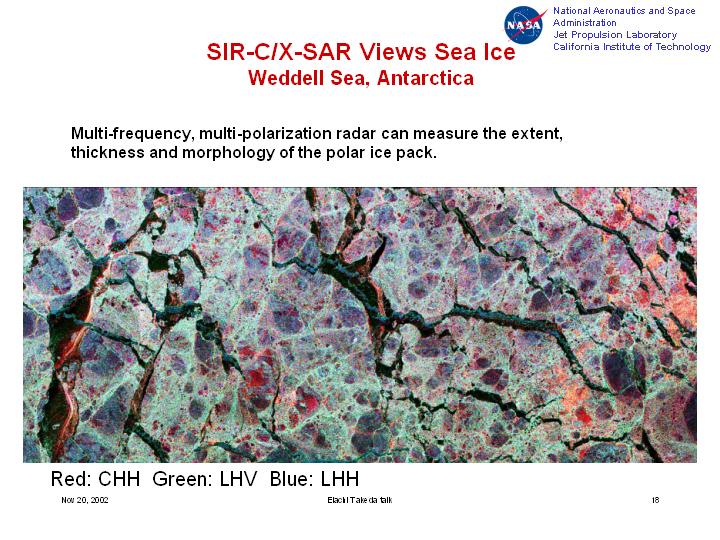
[Slide 18]
The very important situation to help ship navigation is in the Antarctic and Arctic region. These are floating ice - what was important is that we can see where the ice is fractured like you see in here. That will help ships to navigate in the frozen ice by having, from satellite directly transmitted to them, images so if the ships are here they can tell which area to follow to get out of the pack ice. And this capability is now used operationally in Canada, for the polar region using Radarsat to navigate through the Polar Regions during the winter.
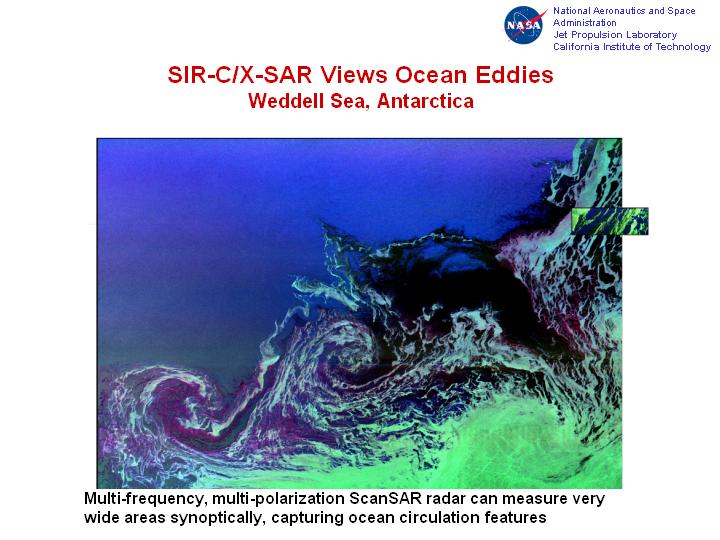
[Slide 19]
Another example of this technique, by looking at the ocean, is monitoring ocean eddies like you see in here and circulation because that will allow to track the nutrients along the coast - where the nutrients are moving - by modeling the dynamics in the ocean.
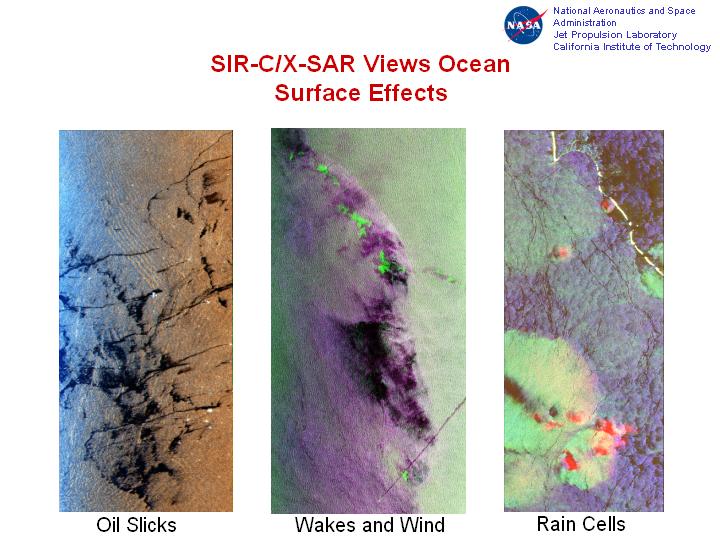
[Slide 20]
These are other illustrations. One is commonly used now in the United States by the coast guard, to monitor ships which are dumping oil in the ocean illegally. For instance, you see here these are oil slicks that were dumped by ship. You see ship here - that has bright point - and the oil slick which is coming out from the ship. The same case here, this picture was taken in the Arabian Sea in the Middle East. Also you can see the front on the ocean - the wind front - you see in here as well as the rain cell of the precipitation changes: the surface structure also is monitored by these radar systems. So it has application from monitoring oil spills, all the way to looking at meteorological phenomena.
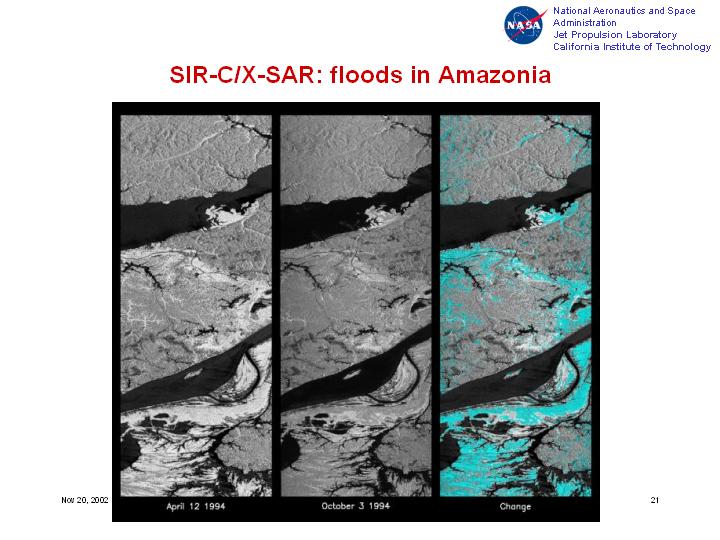
[Slide 21]
Another valuable information as I mentioned to you earlier "we can see through the trees", so these are examples of flood monitoring in the Amazon. This picture was taken on April 12 1994, when there was a flood occurring; this one was on October 3, after the flood occurred. And by looking at the difference, you can see the area where actually the flood was occurring. So if we have these images on a daily basis, we actually can monitor the motion of the flood, or the expansion of the flood, on a routine basis, and therefore provide information for rescue teams in flooded remote areas.
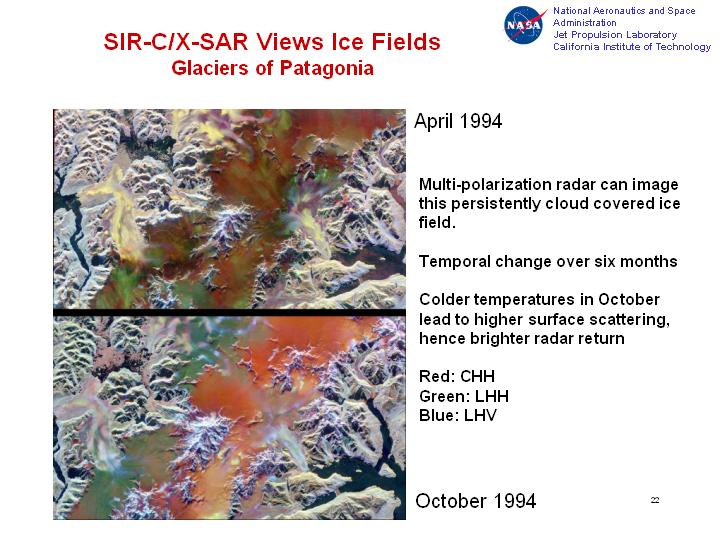
[Slide 22]
This is for scientific purpose: also, another example, we look at the change in glaciers. These were taken in Patagonia. And as you can look at this area in particular, you see the changes which are occurring in the glacier between these two periods of April and October 1994 by looking at the motion which is occurring for those glaciers.
|
|
|