| J. Craig Venter |
 |
|
|
 |
 |

|

|
J. Craig Venter |
|
Celera Genomics |
|
|
 |
|
[figure 19]
[figure 20]
[figure 21]
[figure 22]
[figure 23]
[figure 24]
[figure 25]
[figure 26]
[figure 27]
[figure 28]
[figure 29]
|
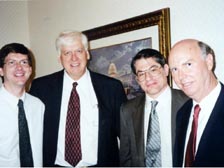
[Figure 19] There are three scientists that had a tremendous impact on this work at TIGR. The tall man in the middle is the Nobel Laureate, Hamilton Smith, who is now around 70 and who still works in the laboratory. He made all the DNA libraries with his own hands -- that was one of our key secrets to success. To his right is Mark Adams, who helped in my lab at NIH with developing the EST method, sequencing the first genome at TIGR and sequencing all the genomes at Celera. Standing next to me is Dr. Gene Myers, the key mathematician who led a team of 22 algorithm specialists and a large number of software engineers to develop the Celera algorithm for assembling the human genome. This was all developed in real time while we were sequencing these genomes.
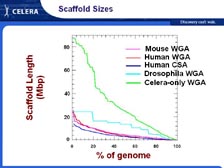
[Figure 20] When we did the first assembly, we thought including all the data published in GenBank would make the assembly even more complete. We didn't realize until we actually sequenced the mouse genome and assembled it -- and we were surprised with the same coverage we had for the human genome -- why the mouse genome came out so much better, till we realized that all the breaks and false joints and problems with the data in GenBank caused the algorithm to make scaffolds. Even so, the scaffolds that we published in Science were two orders of magnitude larger than the group that published in Nature. You can see from the green line -- the 5X coverage was just the Celera data -- how the average size of the scaffolds has gone up in the 30 to 40 million base pair range. In fact, we now have all the human genome in less than 200 scaffolds.
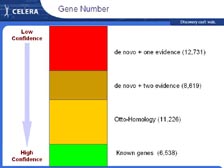
[Figure 21] One of the biggest surprises that we've found from sequencing the human genome was the small number of genes. Some scientists were expecting close to 200,000 genes. The estimates were around 100,000 from many other sources. We have found 26,000 that we can assign with good evidence. There were only 6,500 known genes, not counting the ESTs. Then, from the homology of all the genes found in the genome to known genes, we found another 11,000 genes. With ab initio predictions, you can come up with any number you want. So, we are required to have two or more lines of confirming evidence, for example, a mouse hit or an EST hit. If we have two or more lines of confirming evidence, the number of genes goes up to around 26,000. In addition, we've found around 13,000 genes with only one line of confirming evidence. However, mouse hits and ESTs on their own can give false data. If we look at the chemical composition of those genes, just with one line of evidence, they're very different from the ones with two or more lines of evidence. Therefore, we think most of those will not be real, and the number of genes will be 30,000 or less.
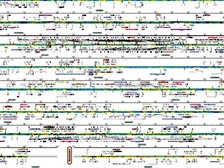
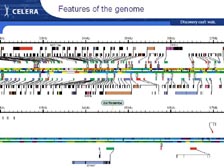
[Figure 22] Looking at the map of the genetic code, I think it's one of the great ironies that we can't display the results of the largest calculation done in biology and medicine on a computer. We needed a very large piece of paper to fold out from Science. This is just looking at a small portion of it. [Figure 23] If we zoom in, you can see there are parts of the chromosomes with very high gene density. We had to show the genes on both sides of the chromosomes. Below is a region we called a "desert." There are millions of letters of genetic code with few or no genes. This was the big surprise of heterogeneity in the genome, and it becomes clear when you look at this why there were so few genes.
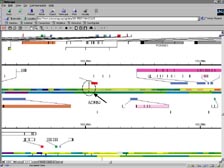
[Figure 24] We can zoom in and find in this circle the one gene that I spent ten years of my own career working on. That's the Beta-2 Adrenergic Receptor with which adrenalin interacts. I have urged scientists around the world to look at the genes and proteins that you have been studying, and find where they are on this map, and then zoom back out and look at that gene or protein in the context of all the other gene information. That's the challenge of biology going forward -- not to focus only on the function of individual genes. We are not alive as functioning individual genes; rather we are alive because of all this information and the more than 100 trillion cells that work together.
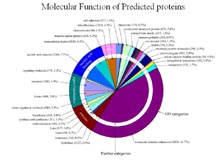
[Figure 25] If we look at those 26,000 genes, what do we see? Scientists had been predicting that the human genome was four times the size of the Drosophila genome. However, when we found 13,000 genes in Drosophila and only 26,000 in human, some of that was quickly revised to say the human genome was just two fruit fly genomes. Therefore, one of the early questions was: Do we just have two of everything that a fruit fly has? And the answer is clearly "no." We can see from the last 600 million years of evolution that separated Drosophila from humans, four major categories of genes that expanded during that time period. For example, all the genes associated with our immune system developed during that time period. The genes associated with hemostasis and the control of our vasculature are basically new during that time frame. Two of the big categories here, signal transduction (all the proteins associated with cell to cell communication), it's not surprising to us that there was a big expansion in those during those times. Most people we know are smarter than fruit flies. However, the biggest surprise was in this blue area, in the nucleic acid binding proteins. You will see in a minute that we have essentially the same genes as mice, and as other mammals, and in the same order. The key step that I think happened in evolution is we used the same information, but we regulated it differently. Therefore, the increase in transcription factors that grew very substantially in the last 600 million years is probably one of the key events allowing for human evolution.
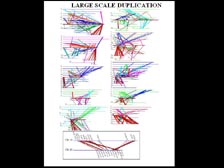
When we look more closely at the genetic code, we can now prove that each of our genetic codes is, in fact, our recorded history. It's the recorded history of billions of years of evolution. I predict in the future we will be able to use this information to trace back and understand each and every major step that took place in the evolution that led to us being alive today. [Figure 26] This is some of that information. It looks very complicated, but we took all the genes on each human chromosome and concatenated them together in the same order and orientation that we found them on that chromosome. Then we asked the question: Do we find those same genes in that same order anywhere else in the human genome? Every place we found three or more genes duplicated, we drew one of these colored lines. In some cases, it was hundreds of genes that were duplicated. This is half of Human Chromosome 20 that was duplicated at some stage and became all of Human Chromosome 18. We need only four evolutionary events to go from that half of Human Chromosome 20 to Human Chromosome 18. I don't think these events happened during human existence. There wasn't half of Chromosome 20 or a smaller chromosome in another species that got duplicated.
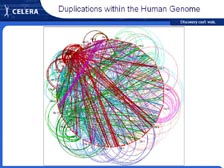
[Figure 27] If we look at all the human chromosomes around the outside of the circle, in every place that we have found three or more genes duplicated, you can see it gets very complicated very quickly. If we look at sets of two or more genes, the circle becomes a solid ball, and we can't even read the information. However, we will be able to put a time, and possibly a species, for each of these events going forward. Chromosome 19 has the highest density of genes of all human chromosomes. That's where all these red lines are coming in out of Human Chromosome 19. What's on Chromosome 19, and why does it have such high density? Chromosome 19 is packed with neuro-transmitter receptors and transcription factors; two of the categories that I told you expanded the most during the last 600 million years. We can track down and see those exact expansions and see which genes are expanded.
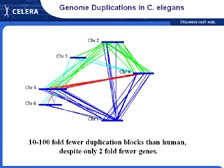
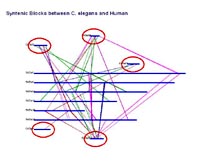
We are making these same maps now from the mouse genome, the rat genome, the dog genome, and now the Fugu genome, which is being done in collaboration with Sydney Brenner. [Figure 28] We can trace back these events if we go back around 800 or 900 million years to C. elegans. We find sets of genes duplicated in the C. elegans genome. Therefore, these happened before the formation of C. elegans as a species. [Figure 29] However, we can track the same duplications to our own chromosomes, showing that these events that took place maybe 900 million years ago were maintained in each one of our genetic codes.
|
|
|